Too fast and too high, but the pain trade is still up
Last week I have called the market spike “irrational exuberance”, 10-days later we are still trading at these higher levels. The air is however getting thinner. The S&P 500 trades far above its 200-day average. But this time the move is broadly supported by non-FANG stocks. A sector rotation into value and cyclicals? Or just a short squeeze? The jury is still out. Part of the rally was driven by short covering after these stocks went up. But for the first time in a very long time we have seen inflows into the equity market.
Fig. 1: S&P 500 trades 12% above its 200-day average
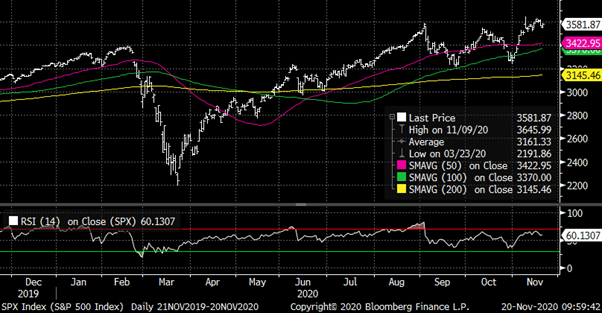
Yesterday after a weak start we have seen another day where everything went up. US treasury yield fell, US corporate traded higher and equities closed higher too. It is remarkable that the Russel 2000 and the Nasdaq move up in tandem. The rally is not just driven by 5-10 FANG+ stocks.
We believe that after the actual consolidation equities will move further up. The RSI of the S&P 500 has slightly decreased and is still not in the overbought area. Nevertheless, given the large distance to the 200-day average a correction of 5-15% can occur any time.
Fig. 2: Inflow into US equites over the last 10 days
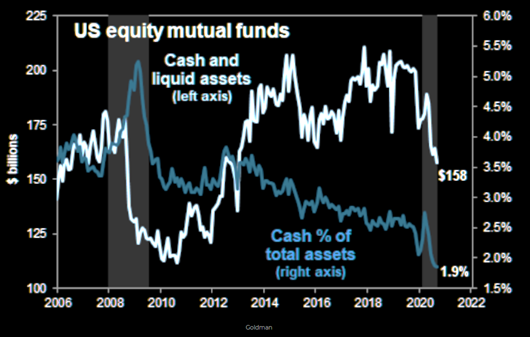
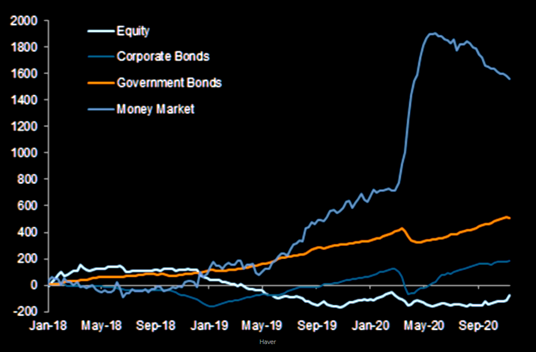
Fig. 3: Outflow of money market into equity: Still a lot of money on the sideline US president
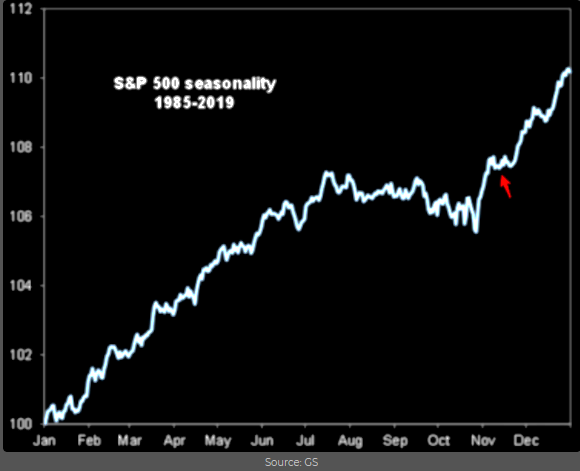
Fear of missing out (FOMO) seems to be one of the drivers. The latest asset manager survey of BofA shows that most participants overweight equities. Also, the Bull/Bear indicator shows an overhang of bulls. This normally is followed by a pullback or a time correction. A time correction means markets trade for some time in a narrow trading range and the overbought situation fades with time. Both cannot be forecasted and might happen any time soon. Seasonality and the announced global stimulus programs will push markets further up in mid-term.
Fig. 4: During the second part of November equity markets moved sideways and then sharply up: but will this happen with COVID-19?
Over the last three months the Nasdaq 100 has underperformed most equity regions, even Europe was slightly better performing. It is remarkable that Russel 2000 was up 14% outpacing Brazil and Asia. Such strong moves in non-major indices show that the rally has broaden not just due to US small caps but also due to most emerging markets. We expect that next year due to a weaker US dollar these regions will continue to perform well.
Having said that we are not calling the end of the tech rally, but rather the beginning of a global synchronized liquidity driven by melt up in equity prices.
Fig. 5: Over the last three months Nasdaq 100 has underperformed even European equites
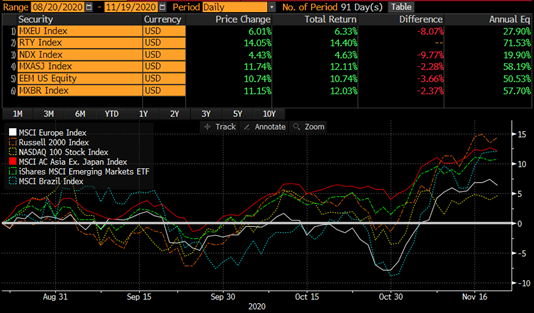
Fig. 6: Largest inflow into tech funds over the last trading days
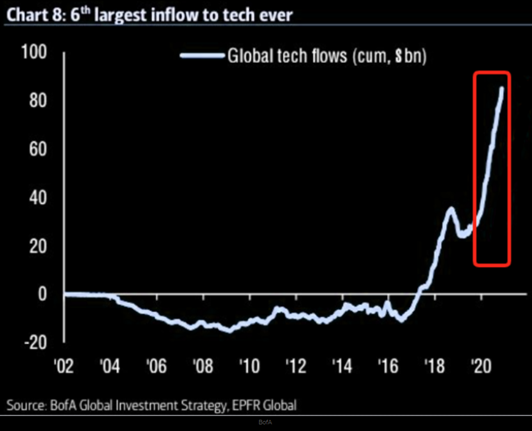
Fig. 7 Remember Nasdaq in 1999: What if we see a similar move up?

Source: The Market Ear
Therefore, the pain trade is still up. Even after the recent inflow into equites there is still a lot of money on the sideline. FOMO will push investor into the market. However, in spring we must either see a pickup in global growth or markets will start to roll over. But until then over the year end the chances for higher prices and stable corporate spreads are high.
Disclaimer: This Blackfort Insights (hereafter «BI») is provided for information purposes only. This document was produced by Blackfort Capital AG (hereafter «BF») with the greatest care and to the best of its knowledge and belief. Although information and data contained in this document originate from sources that are deemed to be reliable, no guarantee is offered regarding the accuracy or completeness. Therefore, BF does not accept any liability for losses that might occur using this information. BI does not purport to contain all the information that may be required to evaluate all the factors that would be relevant for entering into any transaction and anyone hereof should conduct their own investigation and analysis. In addition, the BI includes certain projections and forward-looking statements. Such projections and forward-looking statements are subject to significant business, economic and competitive uncertainties and contingencies, many of which are beyond the control. Accordingly, there can be no assurance that such projections and forward-looking statements will be actualized. The real results may vary from the anticipated results and such variations may be material. No representations or warranties are made as to the accuracy, or reasonableness of such assumptions, or the projections, or forward-looking statements based thereon. This document is expressly not intended for persons who, due to their nationality or place of residence, are not permitted to access such information under local law. It may not be reproduced either in part or in full without the written permission of BF.
© Blackfort Capital AG. All Rights reserved.
Media about us:
-
-
Capital for The Energy-efficient Renovation of Swiss Homes
Uncorrelated earnings in Swiss Francs and more capital for the energetic refurbishment of Swiss houses – In the interview Wanja Eichl, Managing Partner, explains why Blackfort launches the new Swiss Real Estate Debt Fund. Please check it out via the following INTERVIEW Blackfort Swiss Real Estate Debt_e
-
More Capital for The Energetic Refurbishment of Swiss Real Estate
Contact us
Blackfort Capital AG Blackfort Schweiz AG
Talstrasse 61, 8001 Zurich Prime Tower, 8005 Zurich
Tel. +41 44 585 7878 Tel. +41 44 442 3202


