Double US taxes and equity market seloff
The White House plans to double the capital gains tax rate for those earning USD 1 mil or more, from 20% to 39.6%, This would affect about 0.32% of all American taxpayers who report adjusted gross income of more than USD 1 mil and declared at the same time capital gains or losses on their tax statement.
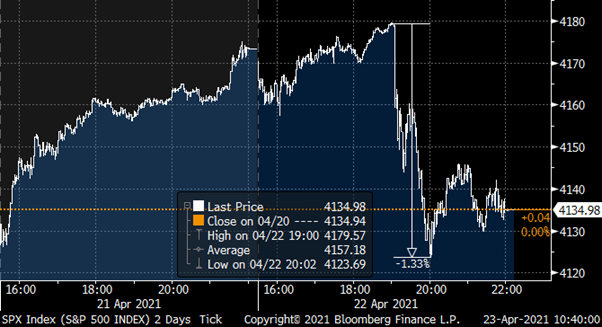
This plan is not new, it was even on a prominent place on the home page of the Biden election campaign. But the Bloomberg headline which crossed the wire yesterday at around 7pm CET was enough to let US equity markets drop by a bit more than 1%. For a taxpayer in New York the total tax on capital gain including Obama tax and others would rise to 52% and in California it would even reach 57%. It is very unlikely that this plan passes both parliaments, but it is just the beginning of a series of expected Biden initiatives to increase taxes to finance the actual fiscal stimulus and the planed infrastructure and green deal packages.
Fig. 1: S&P 500 drops after the tax increase plan was published
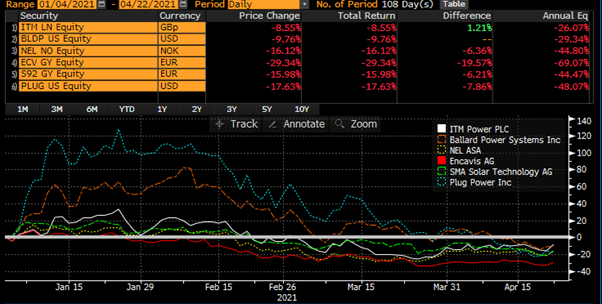
Not all stocks were affected by the tax selloff. The new clean energy sector broadly closed sharply up due to Biden’s plans to invest around USD 15 bn in EV-infrastructure and energy saving infrastructure projects. Solar and wind energy stocks together with hydrogen companies were among the biggest winners in Europa and US equity trading. Nevertheless, since the beginning of the year most of this new energy stocks lost value.
Fig. 2: New Clean energy stocks sold off since February 2021
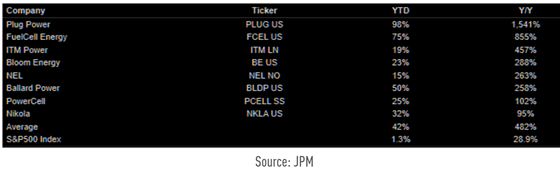
On the 14 of January, we have pointed out the hydrogen sector shows some sings of euphoria, In the actual selloff they were hit the hardest, which is no surprise as for instance Plug Power was up almost 100% during the first 14 days of 2021.
Fig. 3: Hydrogen Shares are showing signs of euphoria (table from BFI 14.01.2021)
However, we do see potential in this sector. The wind energy and solar companies are already established, and most are profitable. In the hydrogen sector most companies are still loss making and it is unclear where this technology will be used in the coming years beside heavy trucks.
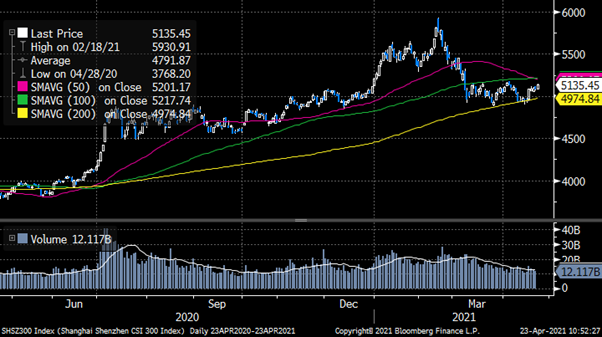
It is interesting that Asian shares are decoupled form US trading. For instance, China A-Shares have fallen to its 200-day average while the US markets reached new all-time highs. Now, however, we see the opposite, while Asian shares do recover, American shares start to consolidate and trend down. Technical indictor like the RSI shows that we are oversold in the CSI 300 index while we are at the same time overbought in the S&P 500.
Fig. 4: China A-Shares (CSI 300) have rebound from its recent lows
Bloomberg has recently published a study which shows that every time over the last 18-months the S&P 500 trades around 16% above its 200-day average we do see a pullback. So far, this countermove has not happened yet.
Fig. 5: S&P 500 at frothy levels
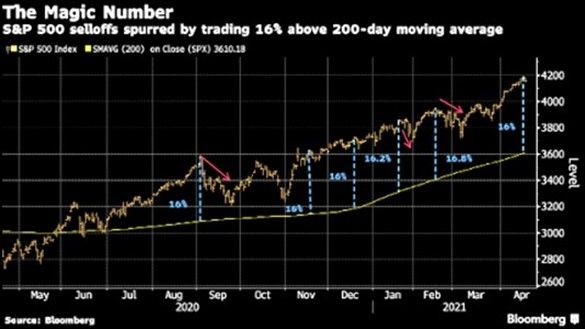
We therefore still expect that the US market will consolidate or even pullback around 10% over the coming weeks. A crash, i.e., more than 15-20% downside is not expected based on the ongoing fiscal and monetary stimulus and the expected acceleration of the global economy.
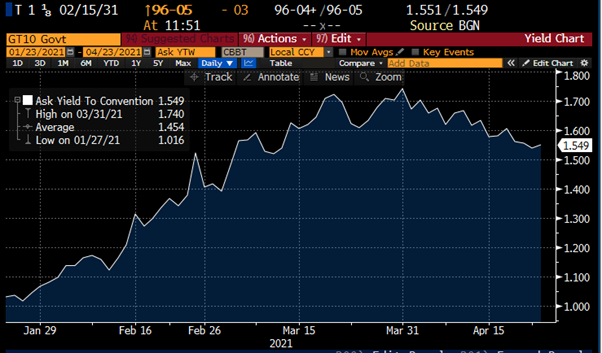
Since the US treasury 10-year yield has reached 1.77% we do see a consolidation and lower yields. We expect slightly higher US yields mid-term as the next data points of CPI and PPI will be higher due to a base effect. But it looks like treasury yields should not be reaching 2% soon. Recent published trading statistic has shown that China and Japan used yield levels above 1.7% to increase their holdings in treasuries, which in hindsight explains why we have seen a continuation of slightly lower US government bond yields.
Fig. 6: 10-year treasury yield continue to decrease
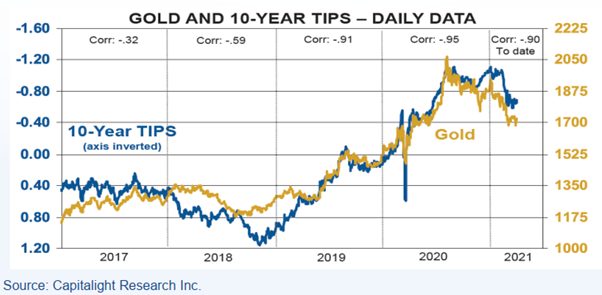
Speaking of gold we believe that the recent twice tested levels below USD 1’700 will mark the low and we might break through the USD 1’800 level over the coming months. If inflation goes up, gold gives a partial protection. There is a strong correlation between the TIPS yield and the gold price. When inflation goes up, we can expect that the TIPS yield drops, and we might see a higher gold price.
Fig. 7: Lower expected TIPS yield (due to inflation) should support a higher gold price
Overall, we must conclude that corporate bond markets and equity markets have moved to levels where a correction must be expected any time. Safer asset like US treasury and US IG corporate bond indices lost around 4% during 2021 and might lose more due to higher expected yields over the coming months.
Having said that we still believe that mid-term equities and real asset like gold should deliver some positive returns. Based on the positive global growth outlook, non-IG bonds might deliver at least an average coupon for the rest of the year as we do not expect a significant spread widening.
Disclaimer: This Blackfort Insights (hereafter «BI») is provided for information purposes only. This document was produced by Blackfort Capital AG (hereafter «BF») with the greatest care and to the best of its knowledge and belief. Although information and data contained in this document originate from sources that are deemed to be reliable, no guarantee is offered regarding the accuracy or completeness. Therefore, BF does not accept any liability for losses that might occur using this information. BI does not purport to contain all the information that may be required to evaluate all the factors that would be relevant for entering into any transaction and anyone hereof should conduct their own investigation and analysis. In addition, the BI includes certain projections and forward-looking statements. Such projections and forward-looking statements are subject to significant business, economic and competitive uncertainties and contingencies, many of which are beyond the control. Accordingly, there can be no assurance that such projections and forward-looking statements will be actualized. The real results may vary from the anticipated results and such variations may be material. No representations or warranties are made as to the accuracy, or reasonableness of such assumptions, or the projections, or forward-looking statements based thereon. This document is expressly not intended for persons who, due to their nationality or place of residence, are not permitted to access such information under local law. It may not be reproduced either in part or in full without the written permission of BF.
© Blackfort Capital AG. All Rights reserved.
Media about us:
-
-
Capital for The Energy-efficient Renovation of Swiss Homes
Uncorrelated earnings in Swiss Francs and more capital for the energetic refurbishment of Swiss houses – In the interview Wanja Eichl, Managing Partner, explains why Blackfort launches the new Swiss Real Estate Debt Fund. Please check it out via the following INTERVIEW Blackfort Swiss Real Estate Debt_e
-
More Capital for The Energetic Refurbishment of Swiss Real Estate
Contact us
Blackfort Capital AG Blackfort Schweiz AG
Talstrasse 61, 8001 Zurich Prime Tower, 8005 Zurich
Tel. +41 44 585 7878 Tel. +41 44 442 3202


